This work spans August–September 2026. Numbers are from a production build measured against a synthetic 1,000-line project; your bottlenecks will differ — that's rather the point of the post.
The same browser-based AI video editor as my previous posts. The editor page is four surfaces on one screen: a script editor (rich text, one line per narrated dialogue), a chapter slide rail, a canvas, and a timeline. On big projects — around 1,000 script lines — typing felt laggy.
The ticket came with the solution already attached: "virtualize the script editor." Render only the visible lines, like every list-performance article says. Reasonable. Obvious, even.
It was wrong, and I'm glad I checked before building it.
Read the code before accepting the premise
Before writing any virtualization code, I read what a script line actually costs. Each line was ~3 DOM nodes with no per-line event listeners. Virtualizing the text editor would remove cheap nodes while breaking the hardest things about a rich-text editor — selection, IME composition, scroll anchoring — for little gain.
The expensive things were elsewhere, and none of them were "too many lines rendered":
- An avatar-picker overlay that mirrored the entire script — ~1,000 dropdown menu instances — and recomputed an O(n²) memo on every keystroke.
- A highlight routine doing a full-document
querySelectorAllsweep on every selection change and every playback tick. - Every debounced keystroke serializing the whole document, rebuilding the project state, deep-cloning it, and running a leftover
JSON.stringifythat nobody read. - Three separate uncoalesced
mousemovelisteners, each walking the DOM.
So I proposed a different plan to the team: baseline first, fix what the profiler indicts, re-measure against the acceptance criteria, and only then virtualize if we're still short. We never got to the virtualization step.
Build the ruler before the furniture
Nothing above counts as knowledge until it's a number. The first real deliverable was a measurement harness: Playwright driving a production build (dev-mode numbers are fiction) against a synthetic 1,000-line fixture, capturing input-to-paint latency percentiles, long tasks, scroll frame times, and DOM counts — results committed as JSON next to the code.
Baseline: typing input-to-paint p95 248ms, DOM 31,536 elements, hover p95 58ms, ~18s to an editable page.
The harness turned out to be the most valuable artifact of the whole project. Every later claim in this post is a diff between two of its JSON files, and it now runs as a budget gate that fails on regression. In two months it proved every unmeasured intuition wrong at least once — including two of mine, which we'll get to.
Round one: hot paths, not architecture
Fixing the indicted list — windowing the overlay to match visible lines, scoping the highlight sweeps, coalescing the mouse listeners, deleting the dead serialization — plus CSS content-visibility on lines:
- DOM: 31,536 → 14,041
- Hover p95: 58ms → 10ms
- Scroll: zero frames over 32ms
- Typing p95: 248ms → 176ms
Real progress — and still failing the <100ms target. The DOM was half the size, the overlay was windowed, and typing barely moved. Whatever was left wasn't about rendering lines. This is where virtualization was formally dropped: it attacks a cost we had already halved with cheaper tools, and the residual lived somewhere else entirely.
The actual problem: one array, four surfaces
Here's the architectural fact the profiler kept pointing at: all four surfaces of the editor page are projections of one array — the project's chapter/dialogue data. Around 72 components subscribed to that whole array. Any keystroke eventually produced a new array identity, and every subscriber re-rendered: the slide rail, the timeline, the canvas — surfaces that had nothing to do with the character you just typed.
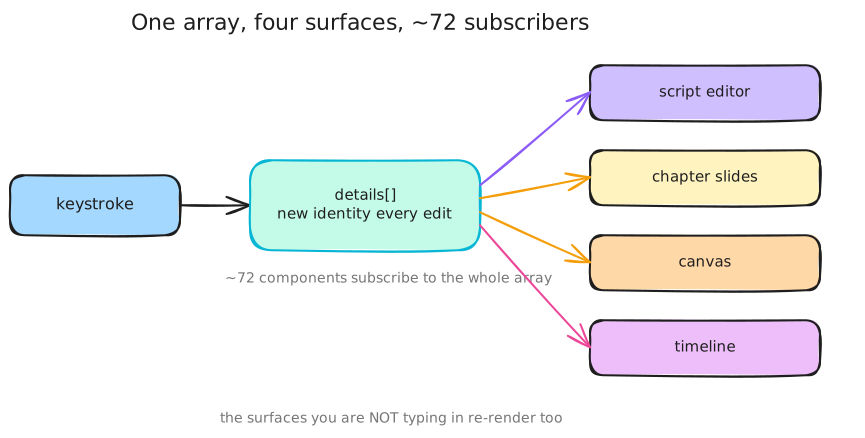
"The editor is slow" was never really about the editor. It was the rest of the page reacting to the editor.
Two changes followed from that diagnosis:
Structural sharing. When an edit touches chapter 3, chapters 1, 2, 4, 5… keep their exact object identity, so any component keyed to an unchanged chapter can bail out of re-rendering with a pointer comparison.
An incremental sequence calculator. The heaviest per-keystroke computation rebuilt the full playback sequence — every chapter, every dialogue, deep-cloning as it went (~40ms per run, multiple runs per keystroke). The replacement recomputes only the edited chapter and reuses every other chapter's result by identity, returning read-only projections instead of clones:
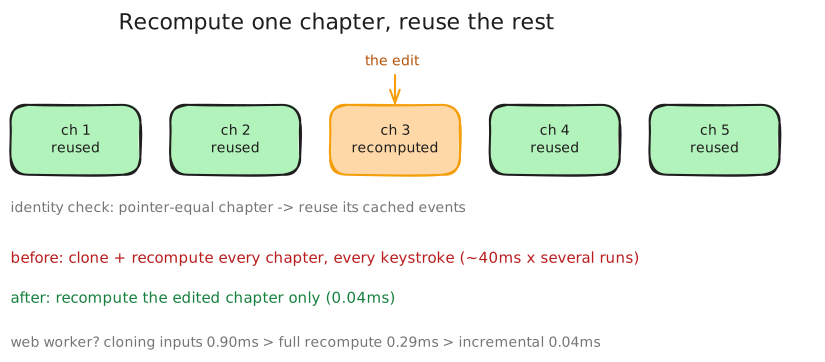
We also considered the fashionable fix — move the computation to a Web Worker. The harness said no: structuredClone-ing the inputs across the thread boundary cost 0.90ms, the full recompute itself only 0.29ms, and the incremental version 0.04ms. Shipping the data to the worker cost three times more than just doing the work. Another obvious solution, measured and declined.
One contract from this work I've reused since: functions that "update" state must return the original object when nothing changed. Identity is information — downstream memoization is only as good as your upstream discipline about not manufacturing new-but-equal objects.
Know how your metric lies
The subtlest finding wasn't in the app — it was in the measurement. Browser event-timing only records interactions above ~16ms, so the latency distribution is censored: as you get faster, cheap events vanish from the denominator and p95 gets dominated by whatever rare expensive event remains. Concretely: if even one state flush lands mid-typing-burst, it is the p95.
That reshaped the debounce design. The intuitive setup — short delay plus a max-wait ceiling — guarantees mid-burst flushes by design. Worse, a short delay re-arms right after each app stall, which we traced producing a self-sustaining ~1.3-second flush cycle while typing continued. The shipped version is a longer trailing-only debounce that reads state at fire time, paired with a flush-on-leave registry so nothing is lost on tab close or navigation (the flush queue drains LIFO — the editor's flush must enter before the guard drains).
It also means honest reporting: on identical code, p95 re-measures anywhere in a 24–136ms band (p50 is a rock-steady 16ms), because the censored denominator shifts run to run. We commit the band, not a cherry-picked point — and the budget gate asserts thresholds chosen with that variance in mind.
The scoreboard
| Metric (1,000-line project, production build) | Baseline | Final |
|---|---|---|
| Typing input→paint p95 | 248ms | 80ms (runs vary 24–136ms) |
| Typing input→paint p50 | ~16ms | 16ms |
| Long-task time per typing burst | ~3,100ms | ~350ms |
| Hover p95 | 58ms | 10ms |
| Frames >32ms while scrolling | present | 0 |
| DOM elements | 31,536 | 14,041 |
| Time to editable | 18.4s | ~11.6s |
Epilogue: auditing the rest of the page
My fixes had focused on the script editor, canvas, and timeline — so the natural question was what the rest of the editor page was hiding. I closed the arc with a whole-page investigation: instrument first, rank later. It produced my favorite scorecard of the project:
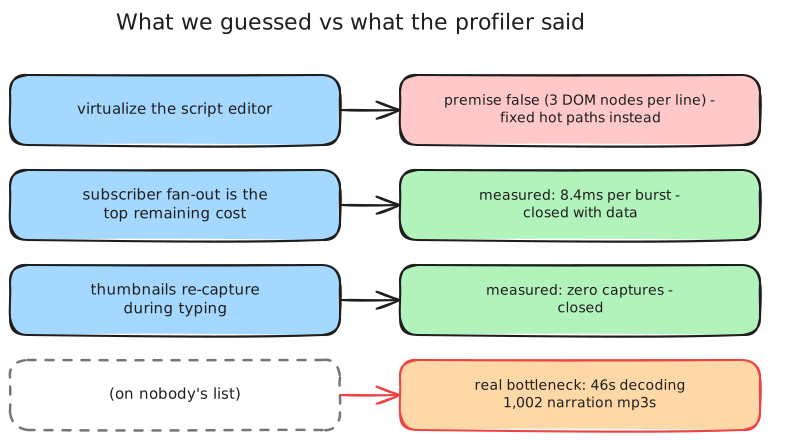
- My own #1-ranked follow-up died. After the typing work, I'd ranked "narrow the remaining whole-array subscribers" as the biggest multiplier left, with a specific per-timeline-clip hook as the villain. Measured: 8.4ms per typing burst. Closed with data, zero lines changed. Deleting planned work is a performance win too — for the team.
- A suspected thumbnail-recapture cost measured zero. Also closed.
- The real next bottleneck was something nobody had ranked: after the page becomes editable, the play button stays disabled for ~46 seconds while the app eagerly fetches and decodes all 1,002 narration audio clips — ~28MB of MP3 inflating toward a gigabyte of decoded PCM — before you can press play. No typing-latency intuition would ever have surfaced that. It's now scoped follow-up work (window the audio around the playhead) with its own acceptance criteria.
What I took away
- Treat the ticket's solution as a hypothesis, not a spec. "Virtualize the editor" named a technique, not a cause. Reading the code for ten minutes falsified the premise before it cost weeks.
- The harness outlives every fix. Percentiles from a production build, committed as JSON, wired into a budget gate — it's the only reason we could close theories instead of arguing about them, and it's the project's permanent regression net.
- Identity is an API. In a state-driven UI, not allocating a new object is a performance feature with a contract attached. Structural sharing upstream is what makes every memo downstream real.
- Understand your metric's failure modes. A censored latency distribution changed our debounce design and our reporting. If you don't know how your number lies, it will lie to you at the worst moment.
- The scoreboard must include the work you didn't do. Virtualization: declined. Web Worker: declined. My top-ranked follow-up: closed at 8.4ms. The 46-second bottleneck none of us predicted: found. That asymmetry — plausible ideas killed, unglamorous truth surfaced — is what measuring first actually buys.